Chapter 2 Datalogger hardware and sensor connections
This chapter focuses on choosing the correct hardware for your measurement system and how to connect sensors to loggers.
2.1 Datalogger options
When choosing a datalogger you should consider at least the following:
- Resolution, input impedance and span.
- The types of channels you need: current, resistance, voltage, thermocouple, force sensors.
- Interface: do you need a standalone logger, real time graphs or internet access.
- Power consumption and size.
- Durability and protection of the logger. Operating temperature.
- Software: does the logger come with useful software. Which programming languages can you use to make your own software?
- Price, unfortunately most projects are have a limited budget and not wasting money on hardware can make a real difference on how much data you can collect (=how many loggers and sites you can use).
Always ask for a product demonstration if possible!
2.1.1 Microcontrollers
Microcontrollers that you program yourself are the most affordable way to build a measurement system. Many controllers have internal ADCs with either 10bit or 12bit resolution. They can also be used to interface more accurate ADC chips as well. You will need to program the controller yourself, but there are a lot examples available for simple systems. You can use microcontrollers to build a standalone system e.g. using SD-cards or you can interface to a computer. Most microcontrollers are programmed in C or C++, but there exists also MicroPython which is a version of Python running on a microcontroller.
These are some good options for data collection projects:
MicroPython is an implementation of Python 3.4 running on a microcontroller. The development boards costs 20 - 30£ and have 12bit ADC. The board also supports UART, SPI and I2C protocols for communication.
Arduino is a popular family of boards, that is programmed in its own language (which is a C/C++ library). The original Arduino boards are based on ATMega microcontrollers with 10bit ADC and the newer ARM based Arduino DUE has 12 bit ADC.
mbed project is backed by ARM and can be used with many affordable microcontroller boards. Most of the boards have 12bit ADC.
2.2 Dedicated DAQs
2.2.1 Cheap DAQs
Cheap data acquisition boards (DAQ) are usually USB boards that require a computer to work. Cheapest ones cost around 100 € have a 12bit differential ADC and 10KHz sample rate.
I have personally good experience from these 2 boards:
NI-USB 6008 8 single-ended or 4 differential inputs, programmable range (-10 – 10V max, -1 – 1V min), counter, 2 DAC channels.
Labjack U3 has similar specifications, but with higher sample rate and supports I2C and SPI protocols
Some of the cheap DAQs work only in limited temperature and humidity ranges. Check the operating conditions from the datasheet if you plan to use them in field or barn conditions. The devices can have a lot of error outside the recommended range even if they seem to give a sensible output.
2.2.2 More expensive DAQs
If you need higher speed and higher resolution the price increases quite rapidly. Here are some examples for different applications:
NI USB-6341 16 analog inputs, 500 kS/s, 16-bit resolution, ±10 V. 4 counters, 2 DACs. 1150 €.
Agilent 34970A Agilent 34970A has a lot of different channels.
- Up to 120 channels for different sensors and very accurate 22bit resolution, but not very fast (250 channels/s).
- Can measure thermocouples, current, small voltage etc.
- Has some memory and can be programmed using serial connection.
Datataker
is a company that makes standalone dataloggers.
For example
Datataker DT80
measures voltage, current resistance, frequency.
- 15 channel @ 25Hz.
- Serial and ethernet interface, internal memory.
- Expansion modules for more channels and CAN logging.
Vector GL1000 is a datalogger designed for collecting data from CANBUS and combine it with GPS and sensors. It can be used together with Vector’s software.
- Log data from tractor ECU and ISOBUS via CAN-bus (2 CAN channels).
- Option to add GPS.
- 4 Analog inputs.
- The logger costs 1700 €, but the software to use it with costs much more than the logger.
2.3 Connecting sensors to loggers
This chapter is about connecting sensors to data loggers. It is something that most beginners struggle with, but is actually quite simple and you’ll learn it quickly.
Affordable data loggers usually have only voltage channels. These are either single-ended Figure 2.1 or differential Figure 2.2 . You can measure changes in resistance or current using voltage channels with simple circuits and some elementary algebra.
2.3.1 Input types and voltage signals
Single-ended connection
Single-ended inputs have a shared ground level for all inputs and the logger. The measurement is made between the common ground level and the positive input. You need to make sure all the connected signals have the same ground level. Interference in one ground wire will show up in all channels. You can only measure positive voltages. Single-ended connection is also sometimes called unipolar .
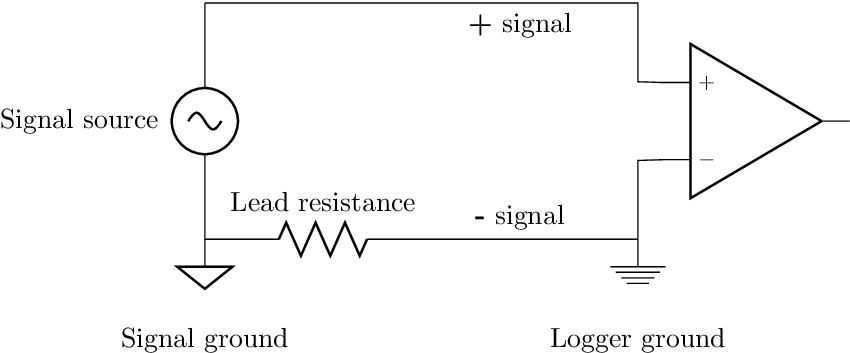
Differential connection
Differential inputs measure the voltage between the negative and positive channel. They are more accurate than single-ended inputs And there is no interference from other channels and the connection is not affected as much by external noise. This is also sometimes called bipolar connection and can also measure both positive and negative voltage.
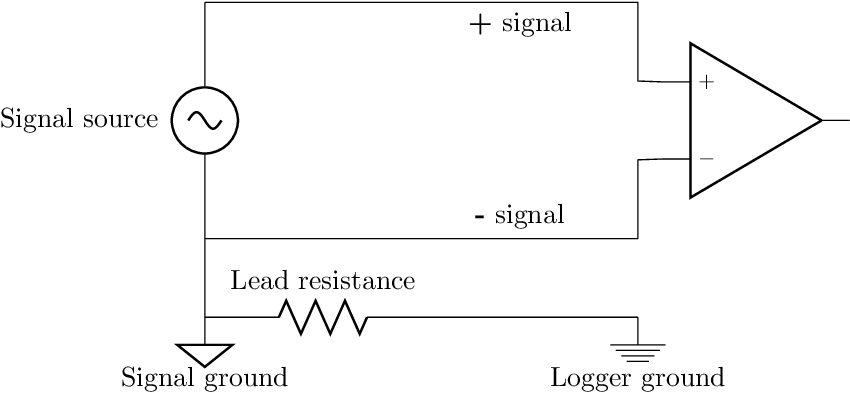
2.3.2 Current signals
Current signals are more noise tolerant than voltage signals and are therefore sometimes used with long wiring. And some sensors just output current instead of voltage. The most common range for current signals is 4–20mA, but there are also other ranges. Some sensors in the department that give current outputs are ultrasound distance sensors, infrared thermometers and air flow sensors.
- Some dataloggers have current channels and you can directly measure current signals.
- You can measure current with a voltage logger using a resistor (sometimes called a shunt) Figure 2.3 .
- The voltage drop across the resistor is \( V=IR \) so the current signal from the sensor is \( I=\frac{V}{R} \) and you need to choose an appropriate resistance for the input span.
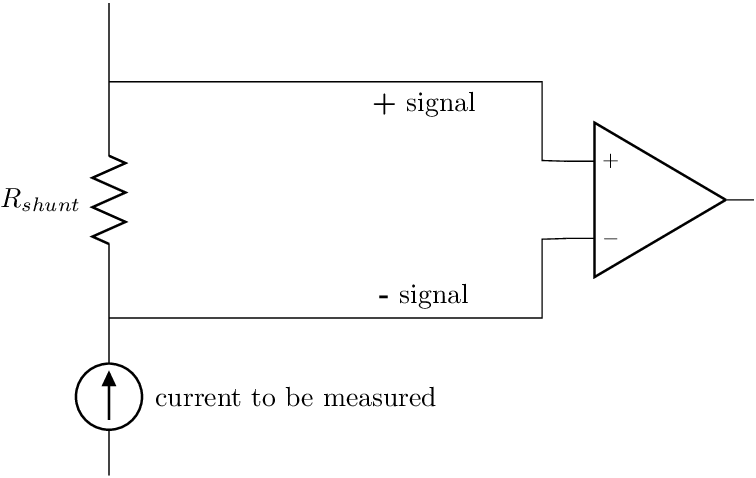
Example:
Suppose you want to connect an ultrasound distance sensor that outputs 4-20mA to LabJack U3 low voltage channel. You will need to choose the shunt resistor so that the maximum voltage is 3.6V (channel’s maximum) at 20mA.
\( R = \frac{V}{I} = \frac{3.6V}{0.02A} = 180 \Omega \)
So you will need to use a resistor that is close to but smaller than 180Ω.
2.3.3 Voltage divider
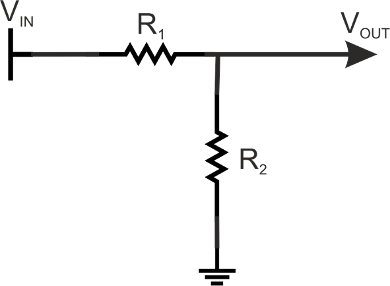
The voltage divider circuit in Figure 2.4 is very useful for three reasons:
- It lets you measure resistance with a voltage channel.
- You can use it lower the input voltage of signals over your loggers range.
- It helps you understand most other circuits.
You should choose fairly small resistor values (<1kΩ) if there is not a lot current(standard resistors can only stand 5W) in the circuit and the output current from sensors is typically very small.
Example: Suppose you wan’t to measure voltage from a sensor that outputs 0–10V using a datalogger that can measure from 0–1.2V (e.g. Xbee). You’ll need find appropriate resistors for circuit in Figure 2.4 . It seems that you need \( \approx \) 10th ( \( \frac{1.2}{10} \) ) of the output voltage so you can start by choosing 1kΩ as R1. The calculation using equation for voltage divider then becomes:
\( 1.2V = \frac{R_2}{1000\Omega + R_2} \cdot 10V \) \( \Leftrightarrow R_2 = \frac{1000\Omega}{\frac{10}{1.2}-1} \approx 136 \Omega \)
The nearest standard resistor value to 136Ω is 130Ω which gives you sensor output from 0 – 1.15V.
2.3.4 Resistance
You can measure resistance using a voltage divider
- Some sensors change their resistance according to the measured quantity.
- The resistance of a sensor can measured with the help of a voltage divider: place the sensor as R1 and choose appropriate R2.
2.3.5 Wheatstone bridge
Wheatstone bridge is an alternative circuit for measuring resistance. It has the same sensitivity as the voltage divider, but there is no DC offset so it is simpler to amplify.
The circuit is frequently used with strain gages and resistive temperature sensors (e.g. PT100)
2.3.6 Amplifying signals
Several sensors (force sensors, thermocouples) give such a small output that it needs to be amplified. Some dataloggers have built in amplifiers and settings for specific sensors or you can buy the amplifier separately.
You can also make the amplifier yourself using operational amplifier (Op-amp) or Instrumentation amplifier components. Op-amps have very high input impedance and very low output impedance. This means that they have very small effect on the input circuit. This is why they can also be used as buffer amplifiers with unity gain for circuits with high output impedance and as components in active filters.
2.3.7 ADC input impedance
The input impedance of the measuring circuit must a lot higher than the output impedance of the measured circuit/sensor.
- Impedance is resistance at a frequency. If there is no capacitance in the input circuit then input impedance is equal to the resistance of the source.
- When the input impedance is high the effect of the measurement to the circuit is low (very little current flows through the measuring circuit).
- ADC datasheets usually report either input impedance or highest allowed source resistance/impedance.
- Input impedance affects the sample-and-hold circuit in the ADC.
ADCs have a sampling capacitor \( C_I \) that charges during sampling. The internal resistance \( R_I \) and the source resistance \( R_S \) form an RC circuit with the sampling capacitor. If \( R_s \) is too high the capacitor doesn’t have time to charge and discharge properly causing: Incorrect readings: noise, and high transient voltage peaks.
These parameters can in the best case scenario found from the datasheet of the ADC and sometimes also results for different configurations. For other loggers you’ll only find the figure for input resistance and no information about capacitor or sampling time, in that case you’ll usually be safe if the input resistance is 50-100 greater than the input impedance.
You can refer to (TI 1998) application note for example circuit and calculations.
2.4 Exercices
- How do you connect a sensor with output voltage range of 0-10V to a datalogger with 0-5V input range? Show the circuit and relevant component values.
- How do you connect a current sensor with 4-20mA output to a voltage channel measuring 0-10V? Show the circuit and relevant component values.
- What is the difference between single-ended and differential connection? What are the advantages of each connection?